Vira Sanaat
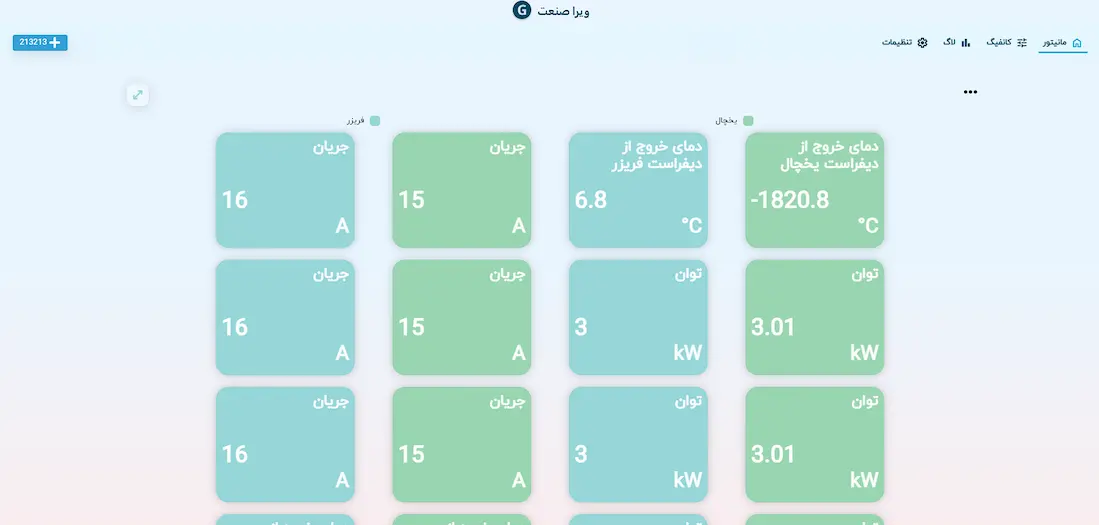
A private web application that connects to devices designed by Rayan Algorithm and modern refrigerator control boards to monitor live data, configure devices, generate reports, and analyze data through detailed charts and filtered lists.
Project Details
- Focus
- Reading live data from the device to the server, displaying it in real time, applying configurations, and providing accurate second-by-second reporting
- Year
- 2025
- Role
- Full-stack software developer (Frontend & Backend), UI/UX Designer
- Client
- Vira Sanaat
- Platform
- Web application
- Duration
- 4 weeks
Project Overview
This web application was built for testing different types of modern refrigerator control boards, including boards used in home refrigerators.
The device and controller designed by Microtech Shomal send live data to the server, and the application reads that data from the server and monitors it in real time. It also allows users to configure the device and provides features such as second-by-second logging with a high level of customization.
The project is a web application, and since it is built as a PWA, it can be installed on most operating systems.
Approach
Each device has its own unique ID. By entering that ID in the system, the user can connect to the device and monitor its data live, configure settings and data, record logs in real time, and analyze the information through different charts and list views.
Logging plays an important role in the system. Users have a high level of control over how data is logged and can define different events based on timing and logging conditions.
The system also supports a fully customizable screen layout with widgets inspired by the iPhone interface, a bilingual interface, and user management with different roles.
Challenge
The main challenge for me in this web application was making the data display as fast and live as possible.
The system and backend had to be designed to process thousands of data points simultaneously and display them in real time.
To handle this, I used SignalR.
Another challenge was handling logs and generating reports for every incoming value. Each piece of data could be recorded with different time-based and behavioral conditions, and at a larger scale, this could put significant pressure on the server.
By using techniques such as averaging between data points and analyzing time-based peaks depending on the data volume, I managed to reduce the server load by up to 30%, which resulted in a noticeable improvement in the application's overall speed.